Oakville’s October 2026 housing market recorded 191 sales, an average selling price of $1,383,011 and 1,025 active listings, according to the Toronto Regional Real Estate Board’s November 4 release.
For buyers and sellers, the useful question is how those citywide numbers relate to the homes they are considering. Here is a closer look at the latest TRREB figures.
Oakville: October 2026 at a Glance
Indicator | October 2026 |
|---|---|
Home sales | 191 |
Average selling price | $1,383,011 |
Median selling price | $1,220,000 |
New listings | 531 |
Active listings at month-end | 1,025 |
Sales-to-new-listings ratio trend | 36.3% |
Months of inventory trend | 4.9 |
Average sale-to-list price ratio | 95% |
Average listing days on market (LDOM) | 37 days |
Average property days on market (PDOM) | 53 days |
Source: TRREB Market Watch, October 2026, Oakville, all home types, page 3. SNLR and inventory trends use 12-month moving averages; they are not October-only ratios.
Buyers Have Options, but Each Segment Is Different
With 1,025 homes listed at month-end, buyers had a range of properties to compare. The 36.3% sales-to-new-listings trend points to supply outweighing completed sales over the measurement period. That supports a selective approach: compare condition, location, carrying costs and recent sales before deciding what to offer.
The citywide average can hide substantial differences between property types. October’s figures included:
Property type | Sales | Average price |
|---|---|---|
Detached | 106 | $1,833,285 |
Semi-detached | 5 | $887,400 |
Attached / row / townhouse | 33 | $977,899 |
Condo townhouse | 11 | $707,545 |
Condo apartment | 34 | $677,274 |
Source: TRREB Market Watch, October 2026, pages 7, 9, 11, 13 and 15. These selected categories exclude two link-home sales. Small samples, especially semi-detached homes, can produce volatile averages.
What Does a 95% Sale-to-List Ratio Mean?
The reported average sale-to-list ratio was 95%. This describes completed transactions relative to their listing prices; it is not a promise that every seller will accept 5% less, or a measure of the discount from every home’s original asking price.
For sellers, pricing should reflect the properties currently competing for the same buyers. Good preparation, clear photography and consistent follow-up remain practical ways to make a home easier to assess and choose.
Plan for the Full Selling Timeline
Sold listings averaged 37 listing days on market. The broader property-days measure was 53 days, accounting for repeat listings by the same seller and brokerage during the original listing contract period. Neither figure measures how long every unsold home has been waiting.
For a move involving a purchase and a sale, leave room for financing, conditions and closing arrangements rather than treating a citywide average as a deadline.
Start With Your Neighbourhood
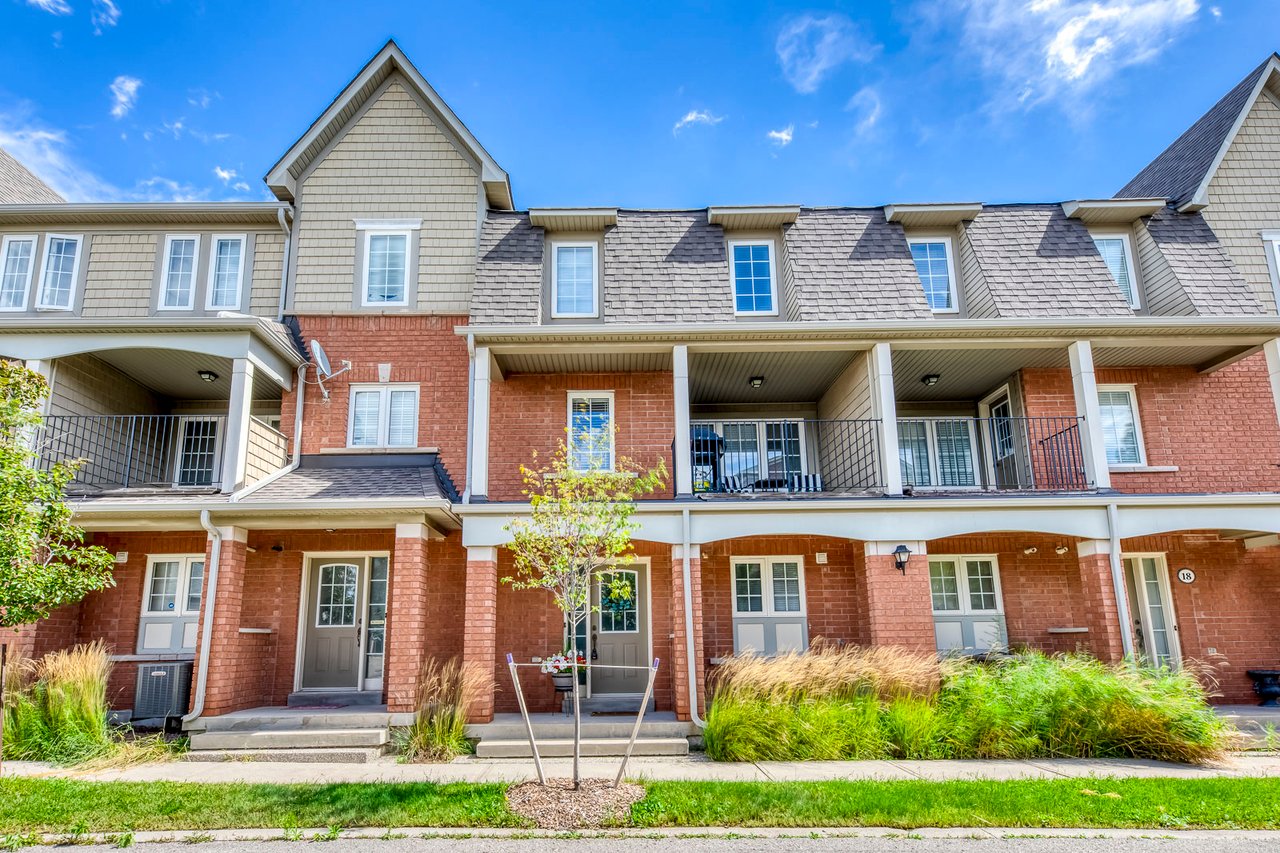
A detached home in Joshua Creek, a townhouse in River Oaks and a condo near the lake compete in different markets. Review recent comparable sales and current alternatives in your own area before applying the overall Oakville average to a specific property.
Explore our October 2026 Oakville Market Report, or browse our Oakville neighbourhood guides.
Thinking about buying or selling? Call or text The Fisher Group at 647-598-8488 for a property-specific discussion.
Data source: Toronto Regional Real Estate Board (TRREB), Market Watch, October 2026, released November 4, 2026. Figures cover the Oakville row in TRREB’s reporting system and may differ from other providers or later revisions. Analysis by The Fisher Group.
Cover: AI-generated illustration inspired by Oakville’s Bronte Harbour; not an on-location photograph.